

Global Urban Heat Island (UHI) Data Set, 2013
Access & Use Information
Public: This dataset is intended for public access and use.
License: No license information was provided. If this work was prepared by an officer or employee of the United States government as part of that person's official duties it is considered a U.S. Government Work.
Downloads & Resources
-
Google Scholar search resultsHTML
Search results for publications that cite this dataset by its DOI.
-
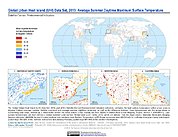
Get a related visualizationJPEG
Sample browse graphic of the data set.
-
Download this datasetHTML
Data Download Page
-
Get a related map visualizationHTML
Maps Download Page
-
View documentation related to this datasetHTML
Documentation Page
-
Use Web Map Service (WMS) to download the...HTML
Web Map Service Page
-
View documentation related to this datasetHTML
Data Set Overview Page
-
Landing PageLanding Page
References
| http://doi.org/10.7927/H408638T |
| https://doi.org/10.7927/H44M92HC |
Dates
| Metadata Created Date | November 12, 2020 |
|---|---|
| Metadata Updated Date | April 24, 2025 |
Metadata Source
- Data.json Data.json Metadata
Harvested from NASA Data.json
Additional Metadata
| Resource Type | Dataset |
|---|---|
| Metadata Created Date | November 12, 2020 |
| Metadata Updated Date | April 24, 2025 |
| Publisher | SEDAC |
| Maintainer | |
| Identifier | C1399941740-SEDAC |
| Data First Published | 2016-10-21 |
| Language | en-US |
| Data Last Modified | 2025-04-23 |
| Category | SDEI, geospatial |
| Public Access Level | public |
| Bureau Code | 026:00 |
| Metadata Context | https://project-open-data.cio.gov/v1.1/schema/catalog.jsonld |
| Schema Version | https://project-open-data.cio.gov/v1.1/schema |
| Catalog Describedby | https://project-open-data.cio.gov/v1.1/schema/catalog.json |
| Harvest Object Id | f0f8d6a8-a736-4177-a725-889c14ea56ec |
| Harvest Source Id | 58f92550-7a01-4f00-b1b2-8dc953bd598f |
| Harvest Source Title | NASA Data.json |
| Homepage URL | https://doi.org/10.7927/H4H70CRF |
| Metadata Type | geospatial |
| Old Spatial | -176.2 -54.86 179.46 78.28 |
| Program Code | 026:001 |
| Related Documents | http://doi.org/10.7927/H408638T, https://doi.org/10.7927/H44M92HC |
| Source Datajson Identifier | True |
| Source Hash | addd92c2ca5c2d73140c7cc0587896755ebf4fa16ea33beac3466b9d67dfa4cc |
| Source Schema Version | 1.1 |
| Spatial | |
| Temporal | 2013-01-01T00:00:00Z/2013-12-31T00:00:00Z |
Didn't find what you're looking for? Suggest a dataset here.