I am trying to plot Extinction_Coefficient_532 from Level-2 Aerosol profile data. Please see the python script (https://github.com/hdfeos/forum/discussions/31)
I’m seeking clarification regarding the indexing of data values and altitude bins in CALIPSO products. According to Table 1 in the CALIPSO documentation (https://asdc.larc.nasa.gov/documents/calipso/quality_summaries/CALIOP_L1ProfileProducts_3.01.pdf), the altitude bin index starts at the top (40 km).
To address this, I reversed the order of data using [::-1] in the script for plotting. However, I’m unsure if this approach is correct and would appreciate feedback from the community.
Thanks!
Altitude value in CALIPSO Level-2 aerosol profile
-
harshbardhan
- Posts: 21
- Joined: Tue Oct 26, 2021 6:43 am America/New_York
-
ASDC - cheyenne.e.land
- Subject Matter Expert

- Posts: 168
- Joined: Mon Mar 22, 2021 3:55 pm America/New_York
- Has thanked: 1 time
- Been thanked: 10 times
Re: Altitude value in CALIPSO Level-2 aerosol profile
Hello,
Yes, the highest altitude is reported first. By the way here is a more recent version of the document you provided:
https://www-calipso.larc.nasa.gov/resources/calipso_users_guide/data_desc/cal_lid_l1_v4-51_desc.php
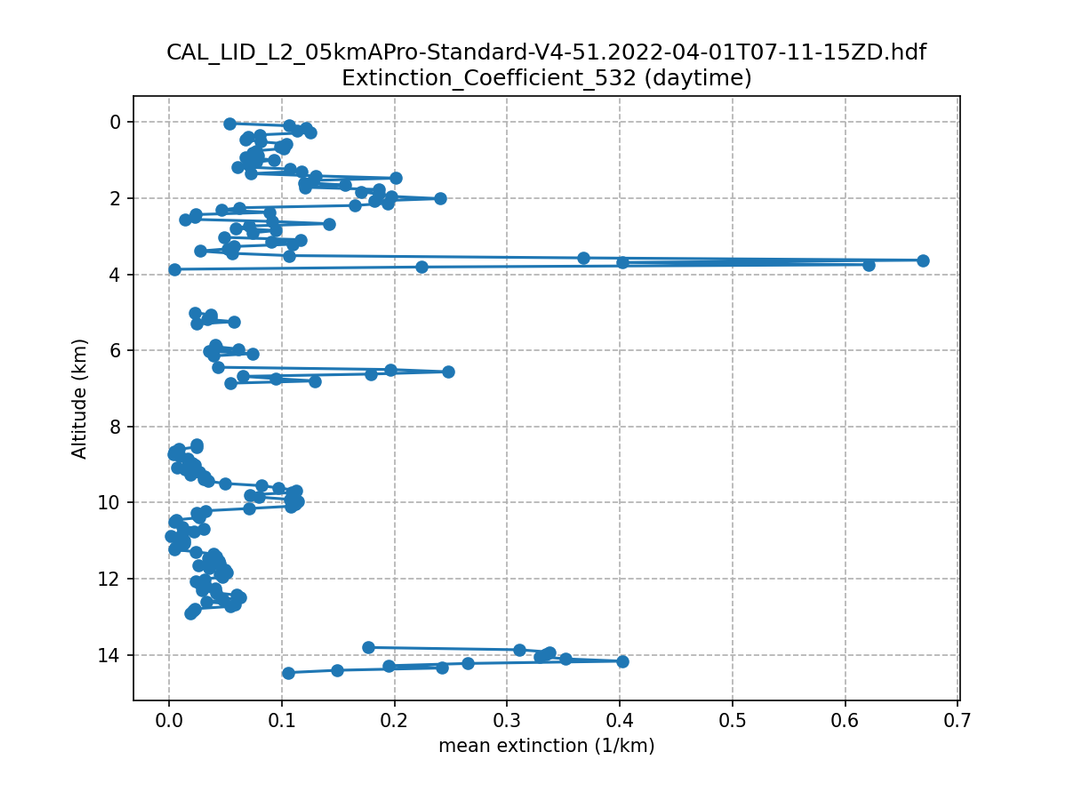
However this should not affect your plot. I took out the indexing that you did to reverse the order ([::-1]) for the variables EXT_532_mean and altitude and got the same graph.
If you want to reverse the y-axis you can use plt.gca().invert_yaxis() (for x-axis use plt.gca().invert_xaxis()). You will get something like this:
Thanks,
ASDC
Yes, the highest altitude is reported first. By the way here is a more recent version of the document you provided:
https://www-calipso.larc.nasa.gov/resources/calipso_users_guide/data_desc/cal_lid_l1_v4-51_desc.php
However this should not affect your plot. I took out the indexing that you did to reverse the order ([::-1]) for the variables EXT_532_mean and altitude and got the same graph.
If you want to reverse the y-axis you can use plt.gca().invert_yaxis() (for x-axis use plt.gca().invert_xaxis()). You will get something like this:
Thanks,
ASDC