
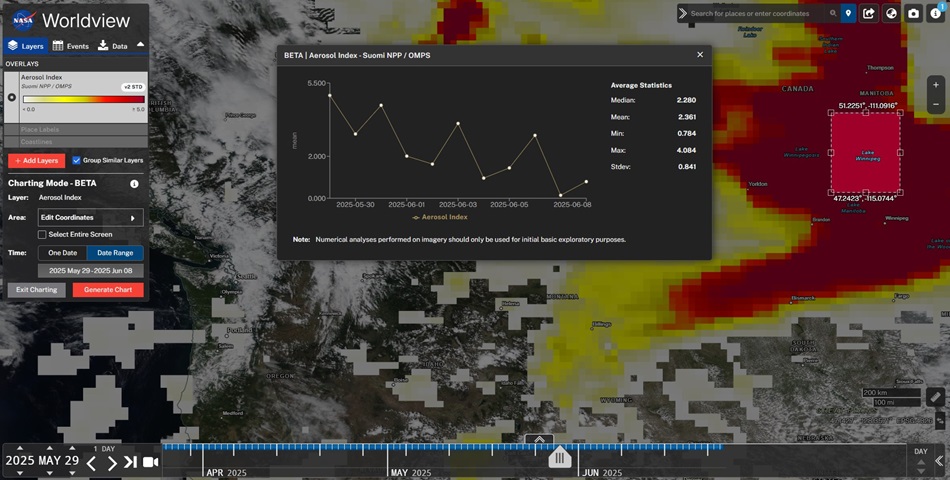
The NASA Worldview imagery mapping and visualization application has added a new charting feature that lets users create a line chart (or graph) offering statistics (e.g., median, mean, minimum, maximum, and standard deviation) for a single variable on a single date or date range for an area of interest. When the charting feature is fully complete, it will allow users to chart more than one variable at a time and increase the number of points being plotted.
To learn more and for step-by-step instructions on how to use this feature check out the new Earthdata blog post at: https://www.earthdata.nasa.gov/news/blog/nasa-worldview-releases-new-charting-tool.