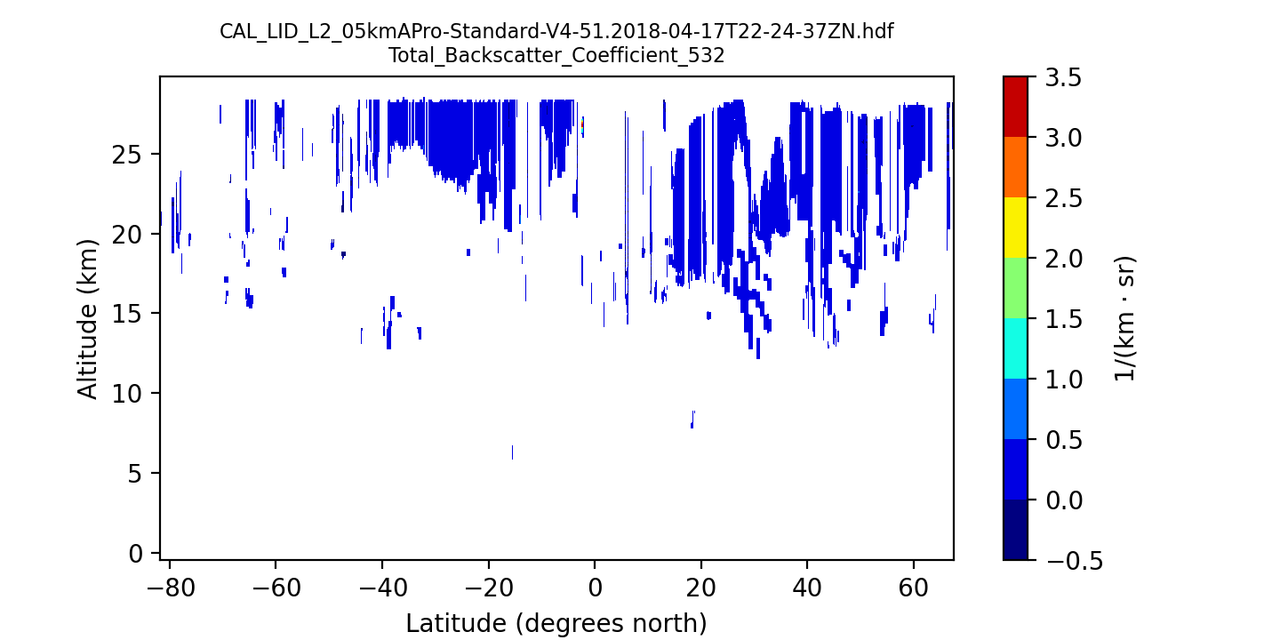
Plotting Total Backscatter Coefficient 532
Posted: Tue Feb 06, 2024 3:18 pm America/New_York
Hello,
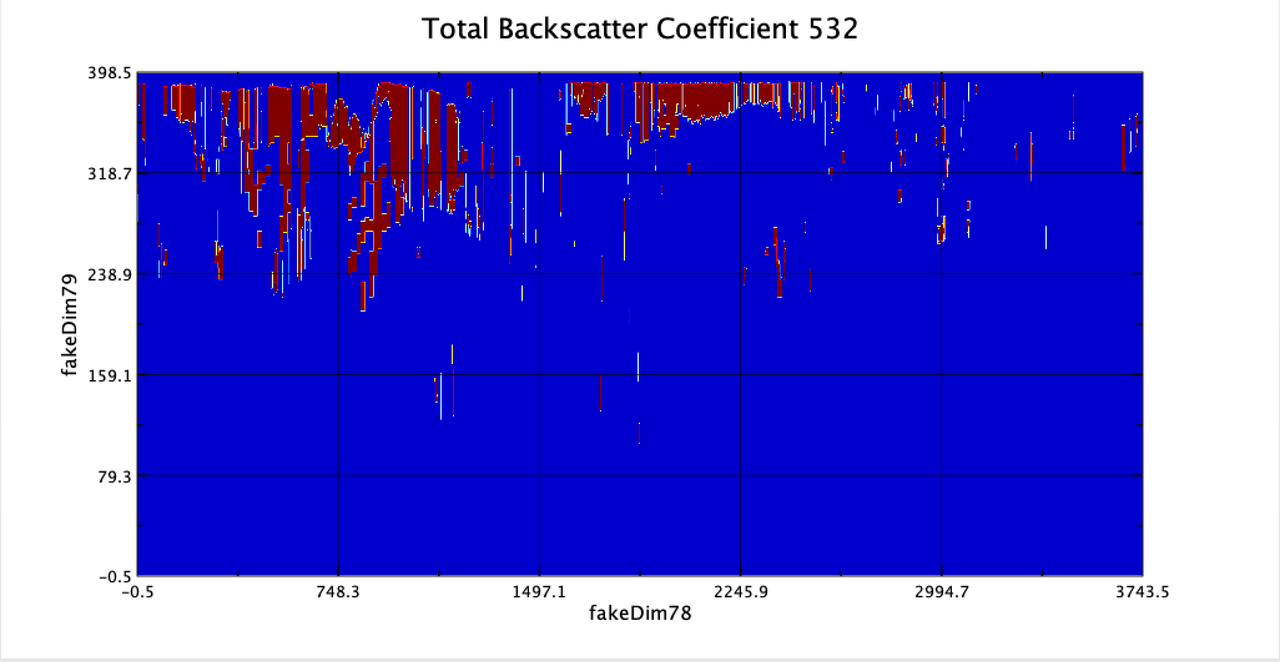
I am trying to plot the total backscatter and I used one of the example codes from the website however, my plot doesn't seem right and I can't fix it.
the problem I am facing is that the plot has a lot of gaps and is flipped to the altitude. no data is plotted from 0 - 15 km altitudes.
this is the file's name 'CAL_LID_L2_05kmAPro-Standard-V4-51.2018-04-17T22-24-37ZN.hdf'
Please help.
I got the example from here viewtopic.php?t=4222