
ECOSTRESS priority data coverage includes the lower (48) continental United States (CONUS), twelve 1,000 x 1,000 km key climate zones, and twelve Fluxnet sites.
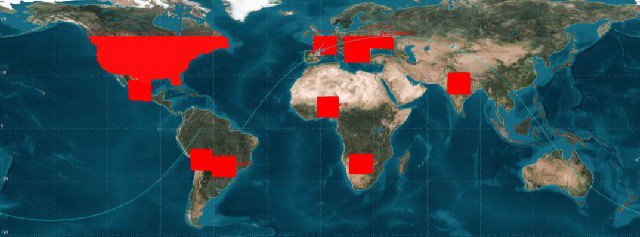
Red polygons represent high priority targets for acquisition. Note instrument is capable of additional coverage and can be commanded to acquire data over additional regions given sufficient downlink.
Why are there Level 1B ECOSTRESS observations over my specific study site, but not matching higher-level observations over my specific site?
There may be ECOSTRESS Level 1B observations that are acquired over your study site, but if the observation lies outside of one of the zones described above, they will not be processed into the L2-L4 products. Also, higher-level products are dependent on a suite of input variables in addition to the Level 1B radiance files. If circumstances such as cloudy observations, missing required input variables, or higher-level product model failures, this will lead to fill values or no data over your study site.
Why are there gaps in the observation record?
ECOSTRESS was launched on June 29, 2018, and moved to autonomous science operations on August 20, 2018, following a successful in-orbit checkout period. On September 29, ECOSTRESS experienced an anomaly with its primary mass storage unit (MSU). ECOSTRESS has a primary and secondary MSU (A and B). On December 5, 2018, the instrument was switched to the secondary MSU and operations resumed with initial acquisitions over Australia and wider coverage resumed on January 9, 2019. The initial anomaly was attributed to exposure to high radiation regions, primarily over the Southern Atlantic Anomaly, and the acquisition strategy was revised to exclude these regions from future acquisitions. On March 14, 2019, the secondary MSU experienced a similar anomaly temporarily halting science acquisitions. On May 15, 2019, a new direct streaming data acquisition approach was implemented, and science acquisitions resumed.
From February 8 to February 16, 2020 an ECOSTRESS instrument issue resulted in a data anomaly that created striping in band 4 (10.5 micron). This anomaly has affected ECOSTRESS Level 1B and Level 2 datasets, which include the attitude, geolocation, radiance, cloud mask, land surface temperature and emissivity data products. These data products have been removed from data access and are no longer available. Masked data are expected to be available by March 16, 2020 for all product levels. Data acquired following the anomaly have not been affected.
Why are some of my Level 1B Radiance observations missing bands 1 and 3?
In order to implement the direct streaming option, the new acquisition approach is to only download TIR data for bands 2, 4, and 5. The data products are as before, except that TIR bands 1 and 3 are not downloaded and contain fill values (in L1 radiance and L2 emissivity). All ECOSTRESS observations from May 15, 2019 to present will contain fill values in bands 1 and 3.
Why do I see striping artifacts in the ECOSTRESS data--even after projecting the swath data to a grid?
There are multiple possible reasons for striping artifacts in ECOSTRESS data acquisitions. (1) Detectors in TIR bands 1 and 5 and the SWIR band were damaged during testing, before launch. This will result in 8 lines of missing data every 128 lines in the across-track direction in those bands, and an error code of -9998 for the missing pixels. These missing pixels are filled using a neural network algorithm, but may appear as striping in cases where the prediction is not accurate. (2) ECOSTRESS is a push-whisk instrument, which means that a scene is made up of 44 scans, stacked in the along-track direction. Each of these scans has an overlap, and so before geolocation, some apparent spatial discrepancies may be observed. This will be visually corrected through geolocation. (3) An overlap between ECOSTRESS scans results in a line overlap and repeating data. Additional information is available in section 3.2 of the User Guide. If using AppEEARS or the swath2grid.py script to reproject the swath data, you still may see artifacts due to nearest neighbor resampling.
Why are there small patches of missing data?
Data are transferred in “packets”, which represent data bundles. Occasionally, a single packet is corrupted as it is transferred from the instrument to the ground data system.
Sometimes there are obstructions in the image, what is this?
Occasionally the ISS must adjust the position of some of its solar panel arrays. These may pass into the ECOSTRESS field of view.
Can I use ECO1BGEO files with corresponding Level 1B - Level 4 files if the build ID and/or product version number differ?
Yes, ECO1BGEO files are not reprocessed unless necessary and thus they may have a build ID and/or product version number different from corresponding Level 1B radiance or higher-level products.
Why do some waterbodies appear to be warmer than land?
Some images taken during nighttime can show higher temperature over waterbodies than surrounding land surfaces and images taken during daytime show lower temperature than surrounding land surfaces.