Note
Access to this page requires authorization. You can try signing in or changing directories.
Access to this page requires authorization. You can try changing directories.
This article describes how to query monitoring data from Operational database and create dashboards on Azure Managed Grafana.
From Azure Managed Grafana linked to Azure Monitor SCOM Managed Instance, you can use SQL queries to get the monitored data from Operational database stored on Azure Managed SQL Managed Instance.
Prerequisites
Before you query monitoring data from Azure Managed Grafana portal, ensure that SCOM Managed Instance is linked to Azure Managed Grafana. For more information, see Dashboards on Azure Managed Grafana.
Few ready-to-use dashboards are available at Azure/SCOM Managed Instance/Operational Dashboard, which can be imported and edited as per your requirement on Azure Managed Grafana instance.
Create a dashboard on Azure Managed Grafana
To create a dashboard, follow these steps:
- Navigate to Grafana and select Add visualization. You can choose the type of visualization based on the available options.

- Under Panel options, enter Title and Description.
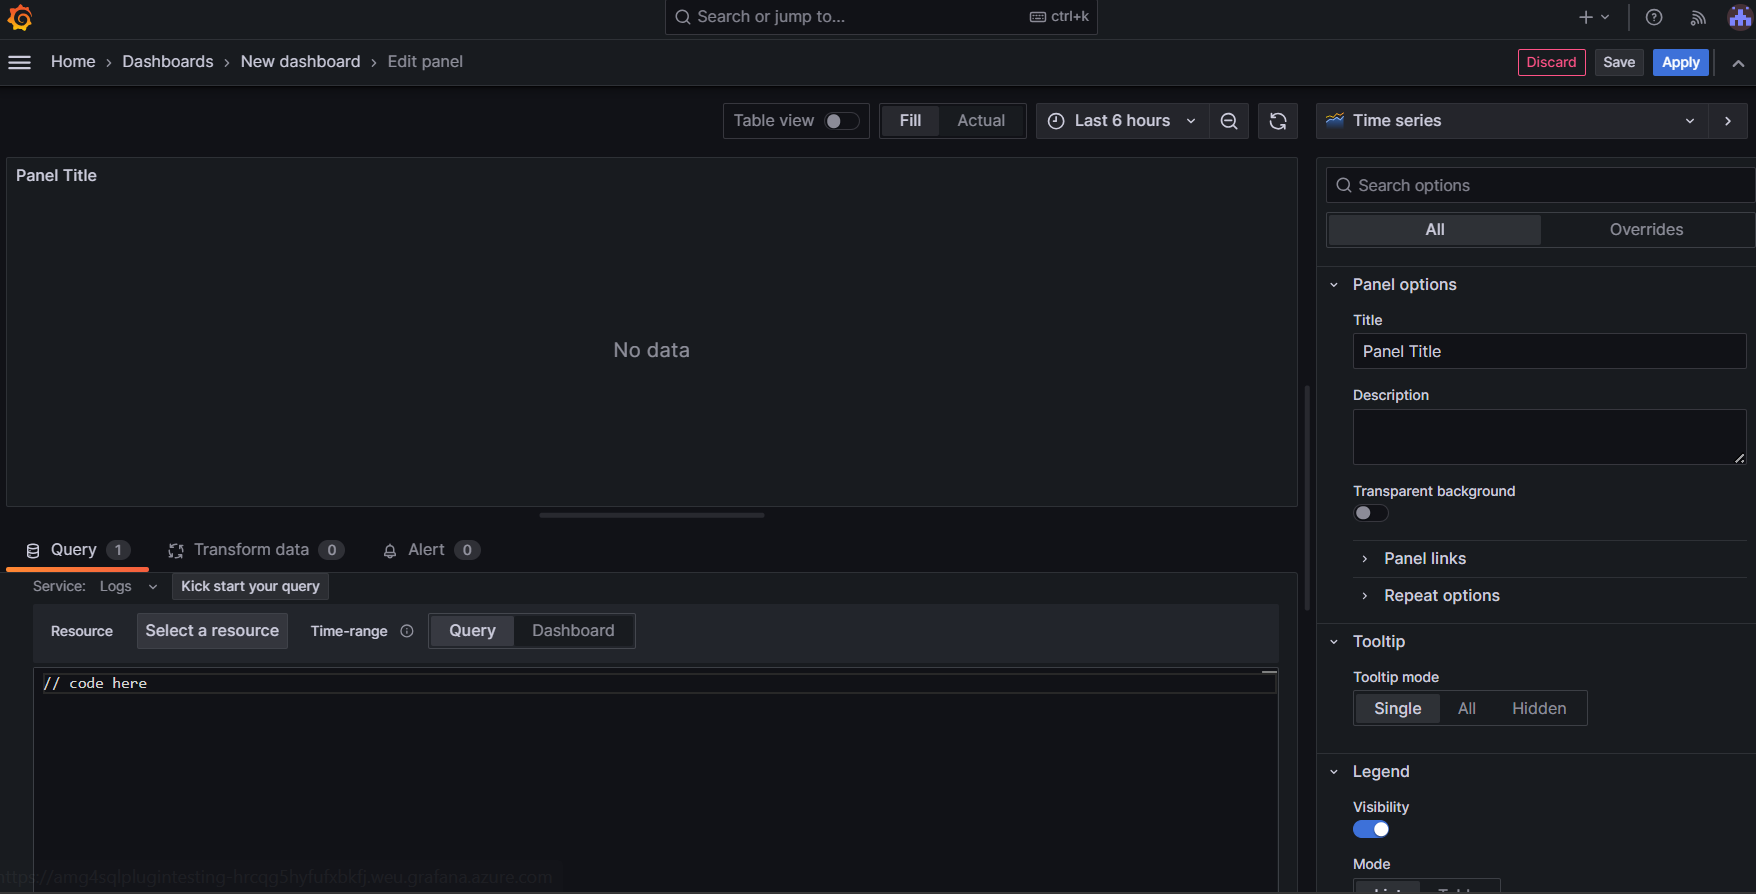
- Under Query, select Code and enter the query.
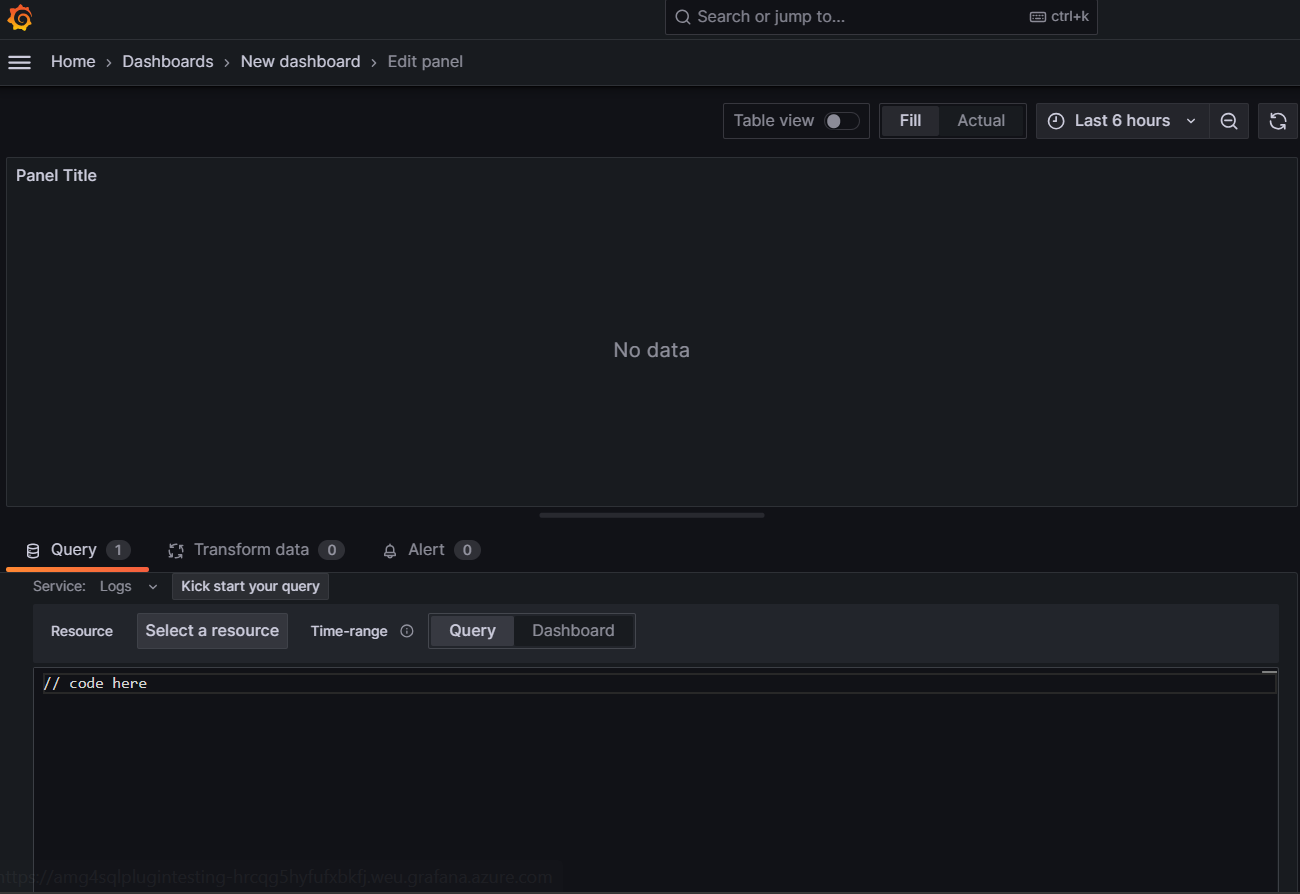
- Select Run query.
Sample queries
Following are few helpful sample queries and dashboards to get started on using Azure Managed Grafana with SCOM Managed Instance:
- Health state of workload
- Workload health and the number of new alerts on them
- Top events on workload
- Top alerts from workload
- Performance data query for workload counter
The following queries help you to build Health, Alerts, and Top events from a particular workload/monitoring object:
Note
- Replace the <Management pack name prefix> with the actual management pack name, say Microsoft.SQL% for SQL workload.
- Replace the <Monitoring Object Type> with component class, say, %.DBEngine for SQL server role.
Health state of workload
SELECT HealthState =

        CASE

            WHEN MEV.HealthState = 1 THEN 'Healthy'

            WHEN MEV.HealthState = 2 THEN 'Warning'

            WHEN MEV.HealthState = 3 THEN 'Critical'

            ELSE 'Uninitialized'

        END,

        CAST(COUNT(*)  AS DECIMAL(5, 2)) AS servers

  FROM ${Database}.[dbo].[ManagedEntityGenericView] MEV

  INNER JOIN ${Database}.[dbo].[ManagedTypeView] MTV ON MTV.Id = MEV.MonitoringClassId and MTV.name like '%.<Monitoring Object Type>'

  INNER JOIN ${Database}.[dbo].[ManagementPackView] MPV ON MPV.Id = MTV.ManagementPackId and MPV.name like '<MP name Prefix>'

  GROUP BY MEV.HealthState

  ORDER BY MEV.HealthState
Workload health and the number of new alerts on them
SELECT MEV.Name

         ,HealthState =

      CASE

        WHEN MEV.HealthState = 1 THEN 'Healthy'

        WHEN MEV.HealthState = 2 THEN 'Warning'

        WHEN MEV.HealthState = 3 THEN 'Critical'

        ELSE 'Uninitialized'

      END

      ,NewAlerts = COUNT(AV.ResolutionState)

  FROM ${Database}.[dbo].[ManagedEntityGenericView] MEV

  INNER JOIN ${Database}.[dbo].[ManagedTypeView] MTV ON MTV.Id = MEV.MonitoringClassId and MTV.name like '%.<Monitoring Object Type>'

  INNER JOIN ${Database}.[dbo].[ManagementPackView] MPV ON MPV.Id = MTV.ManagementPackId and MPV.name like '%<MP name prefix>%'

  INNER JOIN ${Database}.[dbo].[AlertView] AV ON AV.MonitoringClassId = MTV.Id and AV.ResolutionState = 0 AND  $__timeFilter(TimeRaised)

  GROUP BY MEV.Name, HealthState, AV.ResolutionState
Top events on workload
SELECT EventDescription = LT5.LTValue

      ,Count(*) Occurences

      ,AffectedSQLServers = Count(DISTINCT(EV.LoggingComputer))

  FROM ${Database}.[dbo].[EventView] EV

  INNER JOIN ${Database}.[dbo].[ManagedTypeView] MTV ON MTV.Id = EV.ClassId

  INNER JOIN ${Database}.[dbo].[ManagementPackView] MPV ON MPV.Id = MTV.ManagementPackId and MPV.name like '%<MP Name Prefix>%'

  INNER JOIN ${Database}.dbo.LocalizedText LT5 ON EV.EventNumberStringId = LT5.LTStringId AND LT5.LanguageCode = 'ENU'

  WHERE $__timeFilter(TimeGenerated) AND LevelId < 3

GROUP BY Number, LT5.LTValue

ORDER BY Occurences, AffectedSQLServers DESC;
Top alerts from workload
SELECT AV.AlertStringName AS Alert

      ,Occurrence = COUNT(AV.ResolutionState)

      ,AffectedServers = COUNT(MEV.name)

  FROM ${Database}.[dbo].[AlertView] AV

  INNER JOIN ${Database}.[dbo].[ManagedTypeView] MTV ON MTV.Id = AV.MonitoringClassId and MTV.name like '%<Monitoring Object Type>'

  INNER JOIN ${Database}.[dbo].[ManagementPackView] MPV ON MPV.Id = MTV.ManagementPackId and MPV.name like '%M<MP Name Prefix>%'

  INNER JOIN ${Database}.[dbo].[ManagedEntityGenericView] MEV ON MTV.Id = MEV.MonitoringClassId

  where AV.ResolutionState = 0 and  $__timeFilter(TimeRaised)

  GROUP BY AV.AlertStringName, AV.ResolutionState
Performance data query for workload counter
SELECT PD.TimeSampled

   ,CASE

		WHEN BME.Path IS NOT NULL AND BME.Path <> '' THEN CONCAT(BME.Path, '\', COALESCE(BME.Name, ''))

		ELSE COALESCE(BME.Name, '') END AS TagetObjectPath

  ,ObjectName = PC.ObjectName

  ,CounterName = PC.CounterName

  ,Value = PD.SampleValue

  FROM dbo.PerformanceDataAllView PD

  INNER JOIN dbo.PerformanceSource PS ON PD.PerformanceSourceInternalId = PS.PerformanceSourceInternalId

  INNER JOIN dbo.PerformanceCounter PC ON PS.PerformanceCounterId = PC.PerformanceCounterId and CounterName = 'Receive I/Os/sec'

  INNER JOIN dbo.BaseManagedEntity BME ON PS.BaseManagedEntityId = BME.BaseManagedEntityId AND BME.IsDeleted = 0

  INNER JOIN [dbo].[ManagedTypeView] MTV ON MTV.Id = BME.BaseManagedTypeId

  INNER JOIN [dbo].[ManagementPackView] MPV ON MPV.Id = MTV.ManagementPackId and MPV.name like 'Microsoft.SQL%'
Next steps
Troubleshoot issues with Azure Monitor SCOM Managed Instance.