Note
Access to this page requires authorization. You can try signing in or changing directories.
Access to this page requires authorization. You can try changing directories.
Applies to: ![]() SQL Server
SQL Server ![]() Azure SQL Managed Instance
Azure SQL Managed Instance
Troubleshooting replication errors can be frustrating without a basic understanding of how transactional replication works. The first step in creating a publication is having the Snapshot Agent create the snapshot and save it to the snapshot folder. Next, the Distribution Agent applies the snapshot to the subscriber.
This process creates the publication and puts it in the synchronizing state. Synchronization works in three phases:
Transactions occur on objects that are replicated, and are marked "for replication" in the transaction log.
The Log Reader Agent scans through the transaction log and looks for transactions that are marked "for replication." These transactions are then saved to the distribution database.
The Distribution Agent scans through the distribution database by using the reader thread. Then, by using the writer thread, this agent connects to the subscriber to apply those changes to the subscriber.
Errors can occur in any step of this process. Finding those errors can be the most challenging aspect of troubleshooting synchronization issues. Thankfully, the use of Replication Monitor makes this process easy.
Note
The purpose of this troubleshooting guide is to teach troubleshooting methodology. It's designed not to solve your specific error, but to provide general guidance in finding errors with replication. Some specific examples are provided, but the resolution to them can vary depending on the environment. The example errors are based on the Tutorial: Configure replication between two fully connected servers (transactional) tutorial.
Troubleshooting methodology
Questions to ask
- Where in the synchronization process is replication failing?
- Which agent is experiencing an error?
- When was the last time replication worked successfully? Has anything changed since then?
Steps to take
Use Replication Monitor to identify at which point replication is encountering the error (which agent?):
- If errors are occurring in the Publisher to Distributor section, the issue is with the Log Reader Agent.
- If errors are occurring in the Distributor to Subscriber section, the issue is with the Distribution Agent.
Look through that agent's job history in Job Activity Monitor to identify details of the error. If the job history isn't showing enough details, you can enable verbose logging on that specific agent.
Try to determine a solution for the error.
Find errors with the Snapshot Agent
The Snapshot Agent generates the snapshot and writes it to the specified snapshot folder.
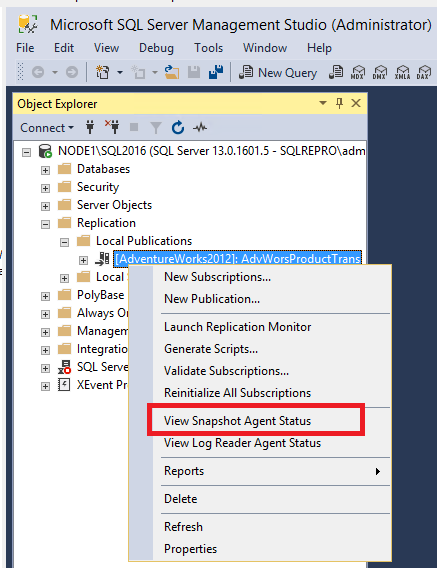
View the status of your Snapshot Agent:
In Object Explorer, expand the Local Publication node under Replication.
Right-click your publication AdvWorksProductTrans > View Snapshot Agent Status.
If an error is reported in the Snapshot Agent status, you can find more details in the Snapshot Agent job history:
Expand SQL Server Agent in Object Explorer and open Job Activity Monitor.
Sort by Category and identify the Snapshot Agent by the category REPL-Snapshot.
Right-click the Snapshot Agent and then select View History.

In the Snapshot Agent history, select the relevant log entry. This is usually a line or two before the entry that's reporting the error. (A red X indicates errors.) Review the message text in the box below the logs:

The replication agent had encountered an exception.
Exception Message: Access to path '\\node1\repldata.....' is denied.


If your Windows permissions aren't configured correctly for your snapshot folder, you see an "access is denied" error for the Snapshot Agent. You need to verify permissions to the folder where your snapshot is stored, and make sure that the account used to run the Snapshot Agent has permissions to access the share.
Find errors with the Log Reader Agent
The Log Reader Agent connects to your publisher database and scans the transaction log for any transactions that are marked "for replication." It then adds those transactions to the distribution database.
Connect to the publisher in SQL Server Management Studio. Expand the server node, right-click the Replication folder, and then select Launch Replication Monitor:

Replication Monitor opens:

The red X indicates that the publication isn't synchronizing. Expand My Publishers on the left side, and then expand the relevant publisher server.
Select the AdvWorksProductTrans publication on the left, and then look for the red X on one of the tabs to identify where the issue is. In this case, the red X is on the Agents tab, so one of the agents is encountering an error:

Select the Agents tab to identify which agent is encountering the error:

This view shows you two agents, the Snapshot Agent and the Log Reader Agent. The one that's encountering an error has the red X. In this case, it's the Log Reader Agent.
Double-click the line that's reporting the error to open the agent history for the Log Reader Agent. This history provides more information about the error:

Status: 0, code: 20011, text: 'The process could not execute 'sp_replcmds' on 'NODE1\SQL2016'.'.
The process could not execute 'sp_replcmds' on 'NODE1\SQL2016'.
Status: 0, code: 15517, text: 'Cannot execute as the database principal because the principal "dbo" does not exist, this type of principal cannot be impersonated, or you do not have permission.'.
Status: 0, code: 22037, text: 'The process could not execute 'sp_replcmds' on 'NODE1\SQL2016'.'.
The error typically occurs when the owner of the publisher database isn't set correctly. This can happen when a database is restored. To verify this:
Expand Databases in Object Explorer.
Right-click AdventureWorks2022 > Properties.
Verify that an owner exists under the Files page. If this box is blank, this is the likely cause of your issue.

If the owner is blank on the Files page, open a New Query window within the context of the
AdventureWorks2022database. Run the following T-SQL code:-- set the owner of the database to 'sa' or a specific user account, without the brackets. EXECUTE sp_changedbowner '<useraccount>'; -- example for sa: exec sp_changedbowner 'sa' -- example for user account: exec sp_changedbowner 'sqlrepro\administrator'You might need to restart the Log Reader Agent:
Expand the SQL Server Agent node in Object Explorer and open Job Activity Monitor.
Sort by Category and identify the Log Reader Agent by the REPL-LogReader category.
Right-click the Log Reader Agent job and select Start Job at Step.

Validate that your publication is now synchronizing by opening Replication Monitor again. If it's not already open, you can find it by right-clicking Replication in Object Explorer.
Select the AdvWorksProductTrans publication, select the Agents tab, and double-click the Log Reader Agent to open the agent history. You should now see that the Log Reader Agent is running and either is replicating commands or has "no replicated transactions":


Find errors with the Distribution Agent
The Distribution Agent finds data in the distribution database and then applies it to the subscriber.
Connect to the publisher in SQL Server Management Studio. Expand the server node, right-click the Replication folder, and then select Launch Replication Monitor.
In Replication Monitor, select the AdvWorksProductTrans publication, and select the All Subscriptions tab. Right-click the subscription and select View Details:

The Distributor to Subscriber History dialog box opens and clarifies what error the agent is encountering:

Error messages:
Agent 'NODE1\SQL2016-AdventureWorks2022-AdvWorksProductTrans-NODE2\SQL2016-7' is retrying after an error. 89 retries attempted. See agent job history in the Jobs folder for more details.
The error indicates that the Distribution Agent is retrying. To find more information, check the job history for the Distribution Agent:
Expand SQL Server Agent in Object Explorer > Job Activity Monitor.
Sort the jobs by Category.
Identify the Distribution Agent by the category REPL-Distribution. Right-click the agent and select View History.

Select one of the error entries and view the error text at the bottom of the window:

Message:
Unable to start execution of step 2 (reason: Error authenticating proxy NODE1\repl_distribution, system error: The user name or password is incorrect.)
This error indicates that the password that the Distribution Agent used is incorrect. To resolve it:
Expand the Replication node in Object Explorer.
Right-click the subscription > Properties.
Select the ellipsis (...) next to Agent Process Account and modify the password.

Check Replication Monitor again, by right-clicking Replication in Object Explorer. A red X under All Subscriptions indicates that the Distribution Agent is still encountering an error.
Open the Distribution to Subscriber history by right-clicking the subscription in Replication Monitor > View Details. Here, the error is now different:

Connecting to Subscriber 'NODE2\SQL2016'
Agent message code 20084. The process could not connect to Subscriber 'NODE2\SQL2016'.
Number:  18456
Message: Login failed for user 'NODE2\repl_distribution'.
This error indicates that the Distribution Agent couldn't connect to the subscriber, because the login failed for user NODE2\repl_distribution. To investigate further, connect to the subscriber and open the current SQL Server error log under the Management node in Object Explorer:

If you're seeing this error, the login is missing on the subscriber. To resolve this error, see Security Role Requirements for Replication.
After the login error is resolved, check Replication Monitor again. If all issues have been addressed, you should see a green arrow next to Publication Name and a status of Running under All Subscriptions.
Right-click the subscription to open the Distributor To Subscriber history once more to verify success. If this is the first time you're running the Distribution Agent, you see that the snapshot has been bulk copied to the subscriber:


Find errors with the Merge Agent
The merge agent can take a long time to replicate changes. To determine which step of the merge replication synchronization process takes the most time, use Trace Flag 101 together with merge agent logging. To do this, use the following parameters for the merge agent parameters, and then restart the agent:
-T 101
-output
-outputverboselevel
Note
If you have to write stats to the <distribution-server>..msmerge_history table, use Trace Flag 102.
A sample output of the merge agent after merge replication synchronization finishes is as follows:
**************************************************************
CONNECTION TIMES --> time took to establish the connection to the servers. Publisher (all connections) 156 msec   Subscriber (all connections) 32 msec Distributor 93 msec
**************************************************************
UPLOAD COUNTERS  --> upload phase (changes from the Sub to the Pub) stats MakeGeneration Time = 343 msec. InsertGenHistory Time = 31 msec. UpdateGenHistory Time = 0 msec. ProxiedMetadata Time = 0 msec.
**************************************************************
DOWNLOAD COUNTERS  --> download phase (changes from the Pub to the Sub) stats MakeGeneration Time = 219 msec. InsertGenHistory Time = 0 msec. UpdateGenHistory Time = 0 msec.
**************************************************************
RETENTION-BASED CLEANUP STATISTICS --> sp_mergemetadataretentioncleanup proc stats Publisher: Cleanup Time 281 msec MSmerge_genhistory rows cleaned up 0 MSmerge_contents rows cleaned up 0 MSmerge_tombstone rows cleaned up 0 Subscriber: Cleanup Time 187 msec MSmerge_genhistory rows cleaned up 0 MSmerge_contents rows cleaned up 0 MSmerge_rowtrack rows cleaned up 0 MSmerge_tombstone rows cleaned up 0
**************************************************************
RETRY STATISTICS Retry Time (Upload) 0 msec. Retry Time (Download) 0 msec. Total changes retried 0 Number of Iterations through rows needing retry 0 Total number of changes that failed despite retry 0
**************************************************************
PROXY METADATA QUEUE COUNTERS Queue Full: Number of Waits: 0, Total Wait Time: 0 msec
**************************************************************
Distributor-side History Logging Time = 219 msec. Number of Distributor-side History Messages Logged = 11 Subscriber-side History Logging Time = 295 msec. Number of Subscriber-side History Messages Logged = 11
**************************************************************
2013-05-28 17:24:11.820 OLE DB Subscriber '<SQL Server name>\sql2008r2': DBCC SQLPERF (NETSTATS)  2013-05-28 17:24:11.822 OLE DB Publisher '<SQL Server name>\SQL2008R2':  DBCC SQLPERF (NETSTATS)  2013-05-28 17:24:11.824 OLE DB Distributor '<SQL Server name>\SQL2008R2':  DBCC SQLPERF (NETSTATS)  NETWORK STATISTICS Server  Reads  Writes  Bytes Read Bytes Written Publisher 74  74  19112  37526 Subscriber 73  73  19032  36931 Distributor 75  75  19192  38121
**************************************************************
NETWORK STATUS Network Connection: The computer has one or more LAN cards that are active. Network link speed: Destination Incoming  Outgoing Publisher Unreachable  Unreachable Subscriber Unreachable  Unreachable Distributor Unreachable  Unreachable
**************************************************************
Enable verbose logging on any agent
You can use verbose logging to see more detailed information about errors occurring with any agent in the replication topology. The steps are the same for each agent. Just make sure that you're selecting the correct agent in Job Activity Monitor.
Note
The agents can be on either the publisher or the subscriber, based on whether it's a pull or push subscription. If the agent isn't available on the server you're investigating, check the other server.
Decide where you want the verbose logging to be saved, and ensure that the folder exists. This example uses c:\temp.
Expand the SQL Server Agent node in Object Explorer and open Job Activity Monitor.

Sort by Category and identify the agent of interest. This example uses the Log Reader Agent. Right-click the agent of interest > Properties.

Select the Steps page, and then highlight the Run agent step. Select Edit.

In the Command box, start a new line, enter the following text, and select OK:
-Output C:\Temp\OUTPUTFILE.txt -Outputverboselevel 3You can modify the ___location and verbosity level according to your preference.

When adding the verbose output parameter, the following issues can cause your agent to fail, or for the outfile file to be missing:
There's a formatting issue where the dash became a hyphen.
The ___location doesn't exist on disk, or the account that's running the agent lacks permission to write to the specified ___location.
There's a space missing between the last parameter and the
-Outputparameter.Different agents support different levels of verbosity. If you enable verbose logging but your agent fails to start, try decreasing the specified verbosity level by 1.
Restart the Log Reader Agent by right-clicking the agent > Stop Job at Step. Refresh by selecting the Refresh icon from the toolbar. Right-click the agent > Start Job at Step.
Review the output on disk.

To disable verbose logging, follow the same previous steps to remove the entire
-Outputline that you added earlier.


Related content
 Get help
- Ideas for SQL: Have suggestions for improving SQL Server?
- Microsoft Q & A (SQL Server)
- DBA Stack Exchange (tag sql-server): Ask SQL Server questions
- Stack Overflow (tag sql-server): Answers to SQL development questions
- Microsoft SQL Server License Terms and Information
- Support options for business users
- Additional SQL Server help and feedback
 Contribute to SQL documentation
Did you know that you can edit SQL content yourself? If you do so, not only do you help improve our documentation, but you also get credited as a contributor to the page.
For more information, see Edit Microsoft Learn documentation.