ファイル:Archimedean spiral polar.svg

この SVG ファイルのこの PNG プレビューのサイズ: 591 × 600 ピクセル. その他の解像度: 236 × 240 ピクセル | 473 × 480 ピクセル | 757 × 768 ピクセル | 1,009 × 1,024 ピクセル | 2,018 × 2,048 ピクセル | 609 × 618 ピクセル。
元のファイル (SVG ファイル、609 × 618 ピクセル、ファイルサイズ: 91キロバイト)
ウィキメディア・コモンズのファイルページにある説明を、以下に表示します。
|
概要
| 解説 |
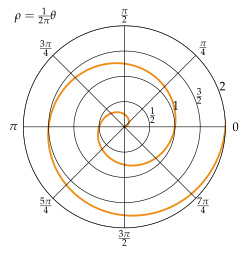
Français : Spirale d'Archimède représentée sur un graphe polaire English: Archimedean spiral represented on a polar graph |
| 日付 | |
| 原典 | 投稿者自身による著作物 |
| 作者 | Guillaume Jacquenot |
Source code (Python)
# -*- coding: utf-8 -*-
#
# Script to plot an Archimedean spiral
#
# http://en.wikipedia.org/wiki/Archimedean_spiral
#
# The Archimedean spiral (also known as the arithmetic spiral
# or spiral of Archimedes) is a spiral named after the 3rd
# century BC Greek mathematician Archimedes. It is the locus
# of points corresponding to the locations over time of a
# point moving away from a fixed point with a constant speed
# along a line which rotates with constant angular velocity.
#
# Text under the
# Creative Commons Attribution-ShareAlike License
# **************************************************************
#
#
# Guillaume Jacquenot
# 2013/03/17

import numpy as np
from fractions import Fraction
import matplotlib
from matplotlib.pyplot import figure, show, rc, grid

def updateThetaAxis(ax):
    thetaFractions = [Fraction.from_float(item/np.pi) for item in ax.get_xticks()]
    labels=[]
    for f in thetaFractions:
        if f.numerator==0:
            labels.append('0')
        elif f.numerator==f.denominator:
            labels.append('\\pi')
        elif f.numerator==1:
            labels.append('\\frac{{\\pi }}{'+str(f.denominator)+'}')
        else:
            labels.append('\\frac{{'+str(f.numerator)+'\\pi }}{'+str(f.denominator)+'}')
    labels = ['$\\Large'+l+'$' for l in labels]
    ax.set_xticklabels(labels,fontsize=20)

def updateRAxis(ax):
    thetaFractions = [Fraction.from_float(item) for item in ax.get_yticks()]
    labels=[]
    for f in thetaFractions:
        if f.numerator==0:
            labels.append('0')
        elif f.numerator==f.denominator:
            labels.append('1')
        elif f.denominator==1:
            labels.append(str(f.numerator))
        else:
            labels.append('\\frac{{'+str(f.numerator)+'}}{'+str(f.denominator)+'}')
    labels = ['$'+l+'$' for l in labels]
    ax.set_yticklabels(labels,fontsize=20)

def makePlot(outputFilename = r'Archimedean_spiral_polar.svg'):
    rc('grid', linewidth=1, linestyle='-') # color='#316931'
    rc('xtick', labelsize=15)
    rc('ytick', labelsize=15)
    rc('font',**{'family':'serif','serif':['Palatino'],'size':14})
    rc('text', usetex=True)

    width, height = matplotlib.rcParams['figure.figsize']
    size = min(width, height)
    fig = figure(figsize=(size, size))
    ax = fig.add_axes([0.12, 0.12, 0.76, 0.76], polar=True, )#axisbg='#d5de9c'

    r = np.arange(0, 3.0, 0.01)
    theta = 2*np.pi*r
    ax.plot(theta, r, color='#ee8d18', lw=3)
    ax.set_rmax(2.0)
    updateThetaAxis(ax)
    updateRAxis(ax)
    grid(True)
    ax.set_title('$\\rho=\\frac{1}{2\\pi}\\theta$',fontsize=20)
    fig.savefig(outputFilename)
    fig.show()

makePlot()
ライセンス
この作品の著作権者である私は、この作品を以下のライセンスで提供します。
このファイルはクリエイティブ・コモンズ 表示-継承 3.0 非移植ライセンスのもとに利用を許諾されています。
- あなたは以下の条件に従う場合に限り、自由に
- 共有 – 本作品を複製、頒布、展示、実演できます。
- 再構成 – 二次的著作物を作成できます。
- あなたの従うべき条件は以下の通りです。
- 表示 – あなたは適切なクレジットを表示し、ライセンスへのリンクを提供し、変更があったらその旨を示さなければなりません。これらは合理的であればどのような方法で行っても構いませんが、許諾者があなたやあなたの利用行為を支持していると示唆するような方法は除きます。
- 継承 – もしあなたがこの作品をリミックスしたり、改変したり、加工した場合には、あなたはあなたの貢献部分を元の作品とこれと同一または互換性があるライセンスの下に頒布しなければなりません。
ファイルの履歴
過去の版のファイルを表示するには、その版の日時をクリックしてください。
| 日時 | サムネイル | 寸法 | 利用者 | コメント | |
|---|---|---|---|---|---|
| 現在の版 | 2013年3月18日 (月) 18:17 | | 609 × 618 (91キロバイト) | AnonMoos | move formula to side, adjust margins |
| 2013年3月17日 (日) 12:49 |  | 540 × 540 (103キロバイト) | Gjacquenot | User created page with UploadWizard |
ファイルの使用状況
以下のページがこのファイルを使用しています:
グローバルなファイル使用状況
次に掲げる他のウィキでもこの画像を使用しています:
- ckb.wikipedia.org での使用状況
- de.wikipedia.org での使用状況
- en.wikipedia.org での使用状況
- eo.wikipedia.org での使用状況
- es.wikipedia.org での使用状況
- fi.wikipedia.org での使用状況
- fr.wikipedia.org での使用状況
- gl.wikipedia.org での使用状況
- he.wikipedia.org での使用状況
- hr.wikipedia.org での使用状況
- la.wikipedia.org での使用状況
- pt.wikipedia.org での使用状況
- ru.wikipedia.org での使用状況
- sl.wikipedia.org での使用状況
- sq.wikipedia.org での使用状況
- sv.wikipedia.org での使用状況
- tr.wikipedia.org での使用状況
- tt.wikipedia.org での使用状況
- zh.wikipedia.org での使用状況