File:Dirac function approximation.gif
No higher resolution available.
Dirac_function_approximation.gif (200 × 335 pixels, file size: 89 KB, MIME type: image/gif, looped, 10 frames, 2.0 s)
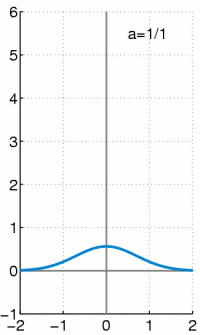
| Description | Illustration of approximating the Dirac delta function by gaussians. |
| Date | (UTC) |
| Source | self-made with MATLAB |
| Author | Oleg Alexandrov |
| I, the copyright holder of this work, release this work into the public ___domain. This applies worldwide. In some countries this may not be legally possible; if so: I grant anyone the right to use this work for any purpose, without any conditions, unless such conditions are required by law. |
Source code (MATLAB)
% Illustration of approximating the Dirac delta function with gaussians.

function main()

   r = 3; % the power in the Bernoulli inequality

   % KSmrq's colors
   red    = [0.867 0.06 0.14];
   blue   = [0, 129, 205]/256;
   green  = [0, 200,  70]/256;
   yellow = [254, 194,   0]/256;
   white = 0.99*[1, 1, 1];

  % Set up the grid and other parameters
   N = 300;
   A = -2; B = 2;
   C=-1; D = 6;

   X = linspace(A, B, N);

   % Set up the figure
   lw = 3; % linewidth
   fs = 18; % font size

   for p=1:10

      a=1/p;

      % gaussian
      Y=(1/(a*sqrt(pi)))*exp(-X.^2/a^2);

      figure(1); clf;

      set(gca, 'fontsize', fs);
      set(gca, 'linewidth', 0.4*lw)
      hold on;

      plot_axes (A, B, C, D, lw/1.5);

      plot(X, Y, 'color', blue, 'linewidth', lw);

      axis equal; axis([A, B, C, D]);

      set(gca, 'XTick', [-2, -1, 0, 1, 2]) % text labels on the x axis
      grid on;

      H=text(B-1.5, D-0.5, sprintf('a=1/%d', p), 'fontsize', fs);

      % save to disk
      file = sprintf('Frame%d.eps', 1000+p);
      disp(file);
      saveas(gcf, file, 'psc2')

      pause(0.1);

   end

 % Converted to gif with the command
 % convert -antialias -density 100 -delay 20 -loop 10000 Frame10* Dirac_function_approximation.gif
 % then scaled in Gimp

function plot_axes (A, B, C, D, lw)

   gray = 0.5*[1, 1, 1];

   plot([A B], [0, 0], 'linewidth', lw, 'color', gray);
   plot([0, 0], [C, D], 'linewidth', lw, 'color', gray);
File history
Click on a date/time to view the file as it appeared at that time.
| Date/Time | Thumbnail | Dimensions | User | Comment | |
|---|---|---|---|---|---|
| current | 22:51, 12 January 2008 | | 200 × 335 (89 KB) | Oleg Alexandrov | tweak |
| 22:22, 12 January 2008 |  | 217 × 363 (99 KB) | Oleg Alexandrov | {{Information |Description=Illustration of approximating the Dirac delta function by gaussians. |Source=self-made with MATLAB |Date=~~~~~ |Author= Oleg Alexandrov |Permission= |other_versions= }} {{ |
File usage
There are no pages that use this file.
Global file usage
The following other wikis use this file:
- Usage on ar.wikipedia.org
- Usage on bg.wikipedia.org
- Usage on bn.wikipedia.org
- Usage on cs.wikipedia.org
- Usage on da.wikipedia.org
- Usage on de.wikipedia.org
- Usage on de.wikibooks.org
- Usage on el.wikipedia.org
- Usage on en.wikipedia.org
- Usage on en.wikibooks.org
- Usage on fa.wikipedia.org
- Usage on fi.wikipedia.org
- Usage on fr.wikipedia.org
- Usage on he.wikipedia.org
- Usage on hi.wikipedia.org
- Usage on hu.wikipedia.org
- Usage on id.wikipedia.org
- Usage on it.wikipedia.org
- Usage on ka.wikipedia.org
- Usage on ko.wikipedia.org
- Usage on nl.wikipedia.org
- Usage on no.wikipedia.org
- Usage on pl.wikipedia.org
- Usage on pt.wikipedia.org
- Usage on ro.wikipedia.org
- Usage on simple.wikipedia.org
- Usage on si.wikipedia.org
- Usage on sl.wikipedia.org
- Usage on sq.wikipedia.org
- Usage on sr.wikipedia.org
- Usage on sv.wikipedia.org
- Usage on uk.wikipedia.org
- Usage on vi.wikipedia.org
- Usage on zh.wikipedia.org