
| This is a file from the Wikimedia Commons. Information from its description page there is shown below. Commons is a freely licensed media file repository. You can help. |
Summary
| Description |
English: derivative of https://en.wikipedia.org/wiki/File:Lagrange_simple.jpg |
||||
| Date | |||||
| Source | Own work based on: Lagrange simple.svg en:File:Lagrange simple.jpg | ||||
| Author |
Original: Jacobmelgaard Vector: |
||||
| SVG development | This oversized trigonometry was created with Inkscape.
This trigonometry uses that can be easily translated using a text editor. |
Source Code
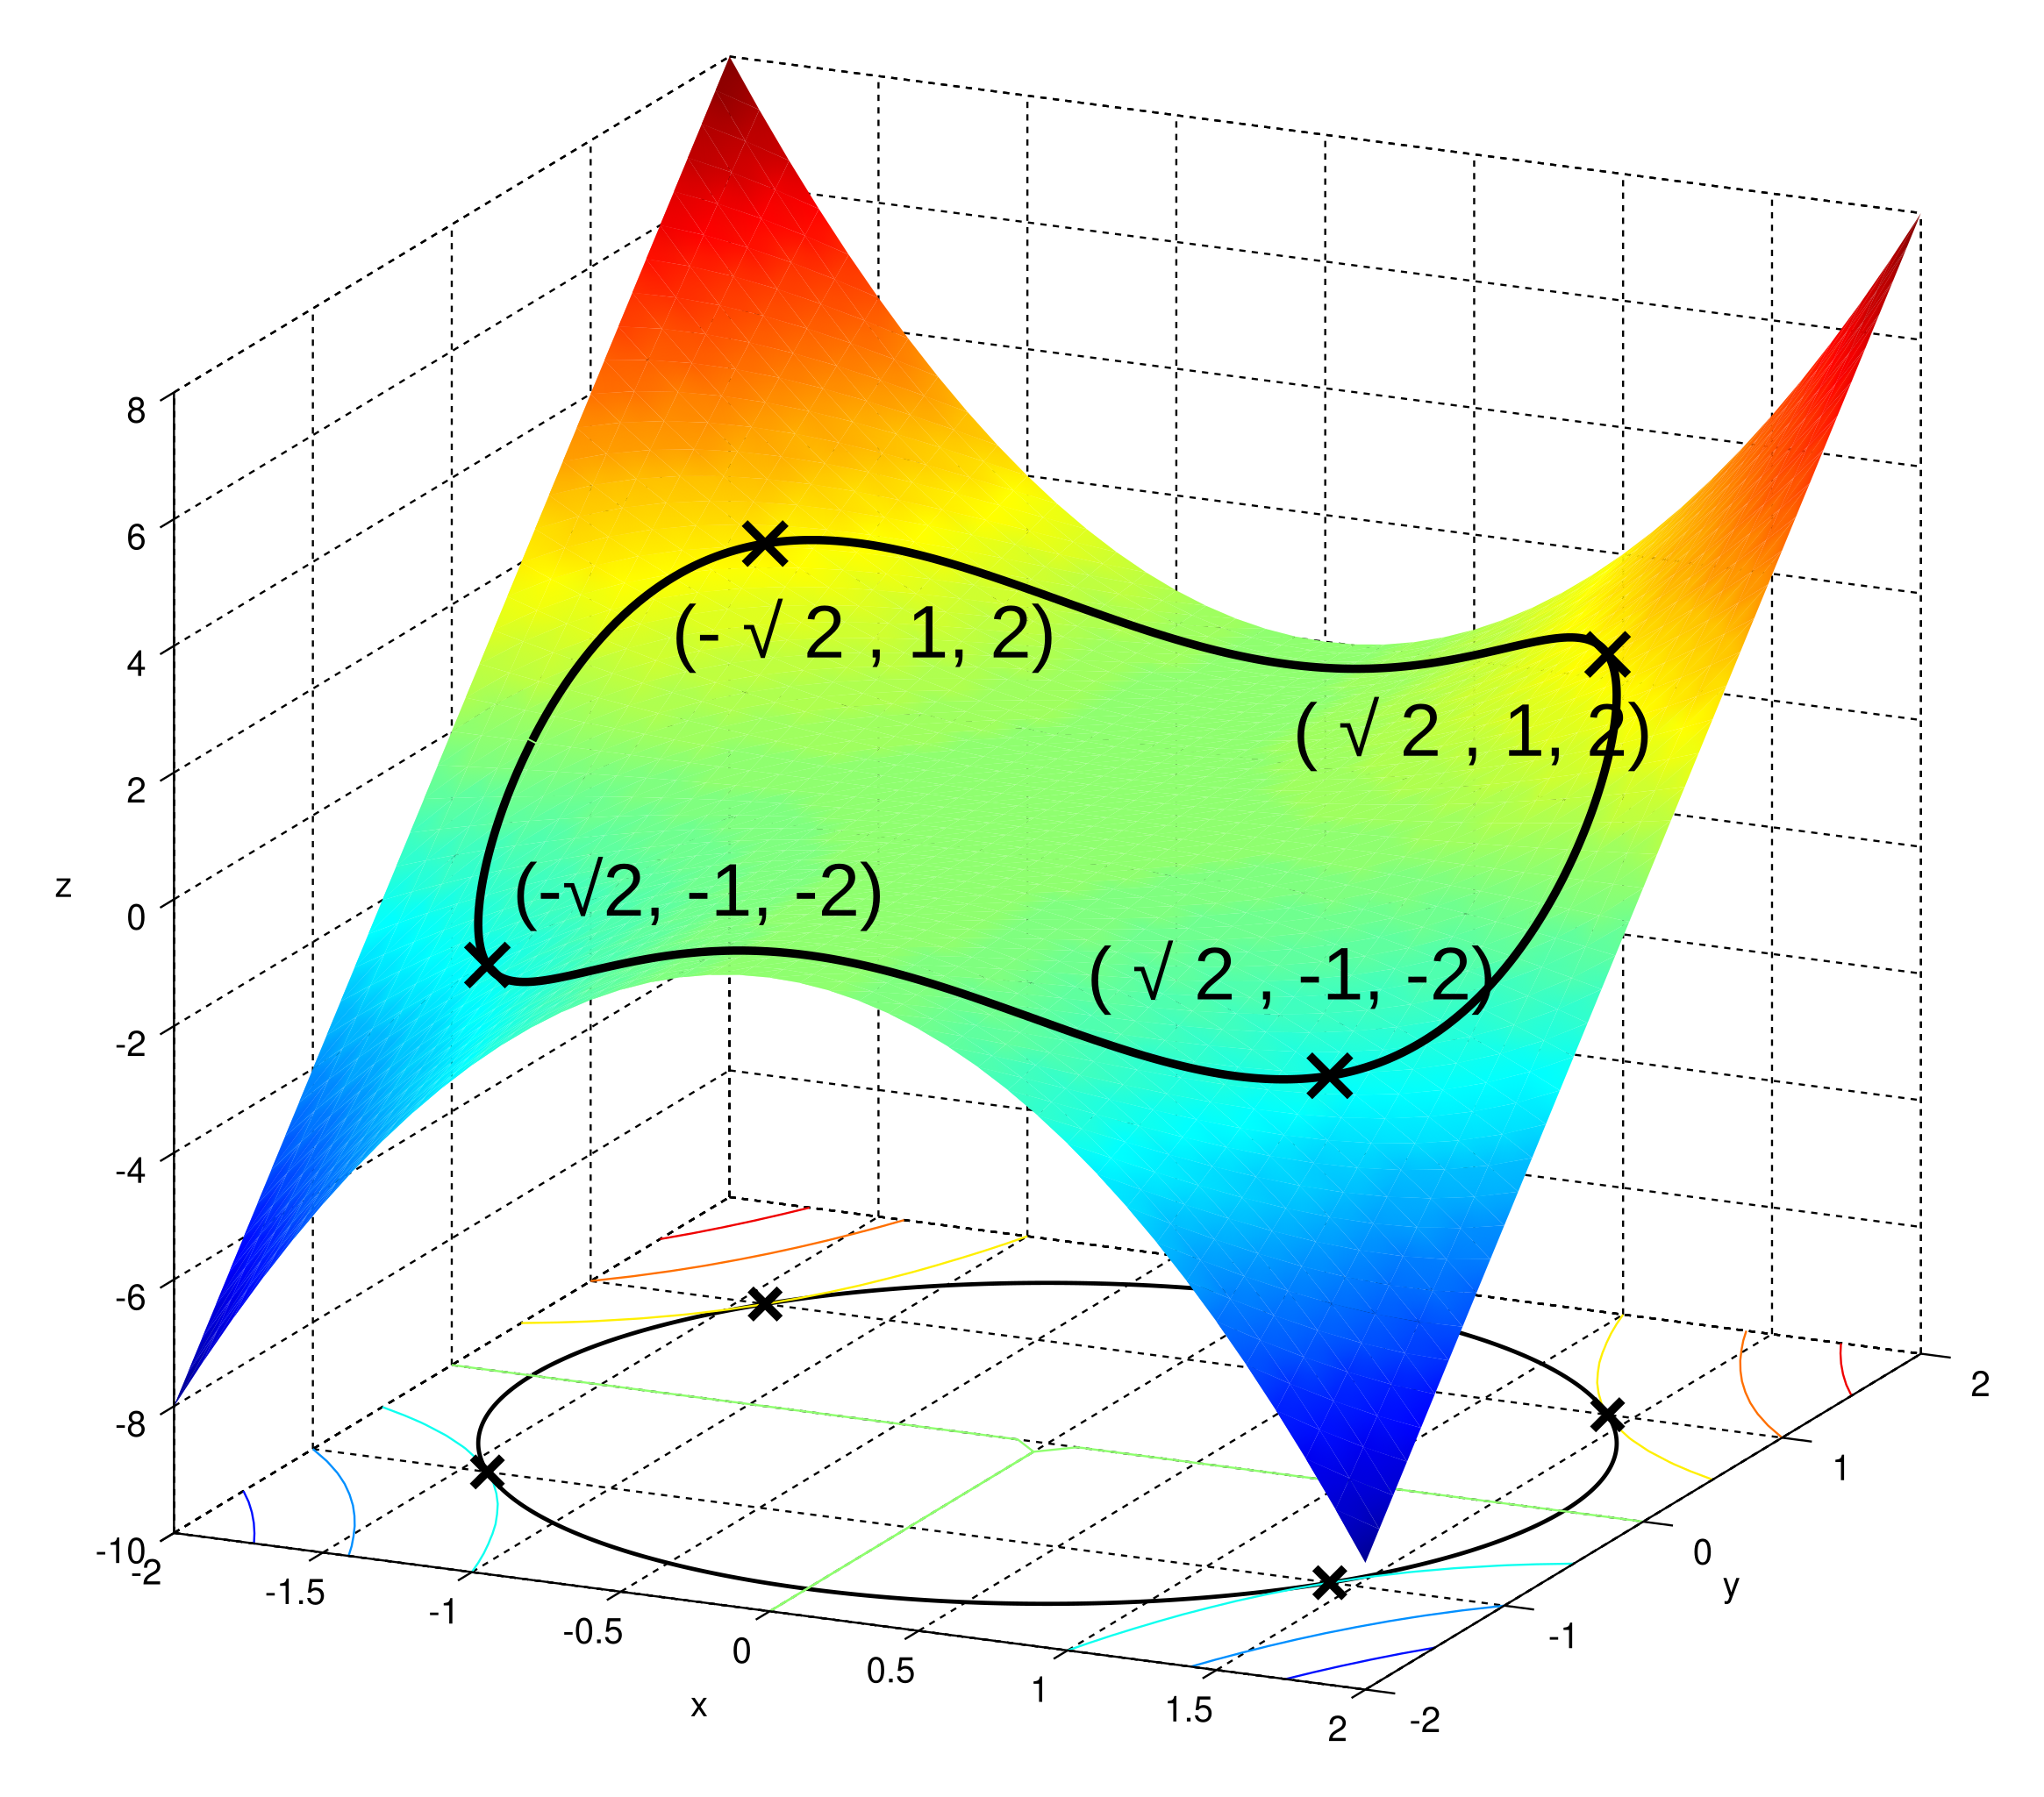
The graph was made in Matlab with the following source code
% Function data
[X,Y] = meshgrid(-2:0.1:2, -2:0.1:2);
Z = (X.^2).*Y;

% Constraint data
t = -pi:0.01:pi;
xc = sqrt(3)*cos(t);
yc = sqrt(3)*sin(t);
zc = xc.^2 .* yc;

% Plot graph and constraint
figure();
surface = surfc(X,Y,Z);

hold on;
plot3(xc, yc, zc, 'k', 'LineWidth', 2);
plot3(xc, yc ,-10*ones(1,length(t)), 'k', 'LineWidth', 1);
set(gcf, 'Color', [1 1 1]);
set(gcf, 'Position', [46 107 767 682]);
% Axis labels
text(0.2, -3, -10, 'x');
text(2.5, -.5, -10, 'y');
text(-2.4, -2, 0, 'z');

% Annotations of the max and min points
% Point indicating max #1
plot3(sqrt(2), 1, 2, 'kx', 'MarkerSize', 14, 'LineWidth', 2);
plot3(sqrt(2), 1, -10, 'kx', 'MarkerSize', 10, 'LineWidth', 2);
text('Interpreter', 'latex',...
        'String', '$$(\sqrt{2}, 1, 2)$$',...
        'Position', [1.1 .1 2.1],...
        'FontSize', 20);
% Point indicating max #2
plot3(-sqrt(2), 1, 2, 'kx', 'MarkerSize', 14, 'LineWidth', 2);
plot3(-sqrt(2), 1, -10, 'kx', 'MarkerSize', 10, 'LineWidth', 2);
text('Interpreter', 'latex',...
        'String', '$$(-\sqrt{2}, 1, 2)$$',...
        'Position', [-1.6 .1 2.1],...
        'FontSize', 20);
% Point indicating min #1
plot3(sqrt(2), -1, -2, 'kx', 'MarkerSize', 14, 'LineWidth', 2);
plot3(sqrt(2), -1, -10, 'kx', 'MarkerSize', 10, 'LineWidth', 2);
plot3(0,1,-3,'kx')
text('Interpreter', 'latex',...
        'String', '$$(\sqrt{2}, -1, -2)$$',...
        'Position', [.5 -.8 -1.4],...
        'FontSize', 20);
% Point indicating min #2
plot3(-sqrt(2), -1, -2, 'kx', 'MarkerSize', 14, 'LineWidth', 2);
plot3(-sqrt(2), -1, -10, 'kx', 'MarkerSize', 10, 'LineWidth', 2);
text('Interpreter', 'latex',...
        'String', '$$(-\sqrt{2}, -1, -2)$$',...
        'Position', [-1.9 -.8 -1],...
        'FontSize', 20);
hold off;
shading interp;
view([25 18]);
%plot2svg must be retrieved from http://www.zhinst.com/blogs/schwizer/
plot2svg;
Corresponding Mathematica code:
Block[{x, y, f = #^2 #2 &, g = #^2 + #2^2 &, c = 3},
 sol = With[{max = MaxValue[{f[x, y], g[x, y] == c}, {x, y}]},
   Solve[{f[x, y] == max, g[x, y] == c}, {x, y}, Reals]
   ];
 Show[
  Plot3D[f[x, y], {x, -2, 2}, {y, -2, 2}, Mesh -> {{c}},
   MeshFunctions -> g, PlotRange -> All, Boxed -> False,
   AspectRatio -> 1, PlotPoints -> 30, MeshStyle -> Cyan,
   PerformanceGoal -> "Quality", ColorFunction -> "DeepSeaColors"],
  Graphics3D[{Red, PointSize[Large], Point[{x, y, f[x, y]} /. sol]}]
  ]
 ]
Licensing
- You are free:
- to share – to copy, distribute and transmit the work
- to remix – to adapt the work
- Under the following conditions:
- attribution – You must give appropriate credit, provide a link to the license, and indicate if changes were made. You may do so in any reasonable manner, but not in any way that suggests the licensor endorses you or your use.
- share alike – If you remix, transform, or build upon the material, you must distribute your contributions under the same or compatible license as the original.
File history
Click on a date/time to view the file as it appeared at that time.
| Date/Time | Thumbnail | Dimensions | User | Comment | |
|---|---|---|---|---|---|
| current | 16:52, 7 August 2012 | | 512 × 450 (5.6 MB) | Zerodamage | Optimized, layers and text relocated |
| 16:23, 7 August 2012 |  | 512 × 455 (2.36 MB) | Zerodamage |
File usage
The following 3 pages use this file:
Global file usage
The following other wikis use this file:
- Usage on uk.wikipedia.org