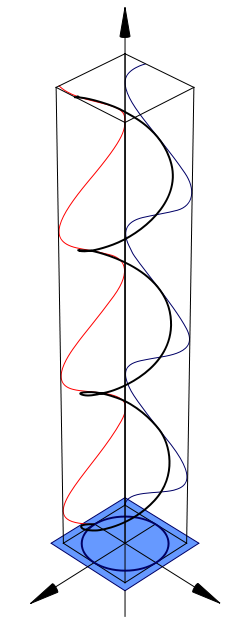
File:Polarisation (Circular).svg

Dimensioni di questa anteprima PNG per questo file SVG: 240 × 600 pixel. Altre risoluzioni: 96 × 240 pixel | 192 × 480 pixel | 307 × 768 pixel | 409 × 1 024 pixel | 819 × 2 048 pixel | 250 × 625 pixel.
File originale (file in formato SVG, dimensioni nominali 250 × 625 pixel, dimensione del file: 11 KB)
Cronologia del file
Fare clic su un gruppo data/ora per vedere il file come si presentava nel momento indicato.
| Data/Ora | Miniatura | Dimensioni | Utente | Commento | |
|---|---|---|---|---|---|
| attuale | 08:38, 12 feb 2007 | 250 × 625 (11 KB) | Inductiveload | ||
| 05:01, 12 feb 2007 | 250 × 625 (373 KB) | Inductiveload | {{Information |Description= |Source=Own drawing down in Mathematica, edited in Inscape. |Date=12/02/07 |Author=inductiveload |Permission={PD-self} |other_versions=Linear polarisation [[:image:Polarisation (Elliptical) |
Pagine che usano questo file
Nessuna pagina utilizza questo file.
Utilizzo globale del file
Anche i seguenti wiki usano questo file:
- Usato nelle seguenti pagine di bn.wikipedia.org:
- Usato nelle seguenti pagine di bs.wikipedia.org:
- Usato nelle seguenti pagine di de.wikipedia.org:
- Usato nelle seguenti pagine di en.wikipedia.org:
- Usato nelle seguenti pagine di en.wikibooks.org:
- Usato nelle seguenti pagine di es.wikipedia.org:
- Usato nelle seguenti pagine di et.wikipedia.org:
- Usato nelle seguenti pagine di fa.wikipedia.org:
- Usato nelle seguenti pagine di fr.wikipedia.org:
- Usato nelle seguenti pagine di fr.wikiversity.org:
- Usato nelle seguenti pagine di he.wikipedia.org:
- Usato nelle seguenti pagine di hi.wikibooks.org:
- Usato nelle seguenti pagine di jv.wikipedia.org:
- Usato nelle seguenti pagine di km.wikipedia.org:
- Usato nelle seguenti pagine di ko.wikipedia.org:
- Usato nelle seguenti pagine di mk.wikipedia.org:
- Usato nelle seguenti pagine di ne.wikipedia.org:
- Usato nelle seguenti pagine di no.wikipedia.org:
- Usato nelle seguenti pagine di ru.wikipedia.org:
- Usato nelle seguenti pagine di sa.wikipedia.org:
- Usato nelle seguenti pagine di sh.wikipedia.org:
- Usato nelle seguenti pagine di te.wikipedia.org:
- Usato nelle seguenti pagine di tr.wikipedia.org:
- Usato nelle seguenti pagine di tum.wikipedia.org:
- Usato nelle seguenti pagine di uk.wikipedia.org:
- Usato nelle seguenti pagine di vi.wikipedia.org:
- Usato nelle seguenti pagine di zh.wikipedia.org:
Visualizza l'utilizzo globale di questo file.
