File:Spherical harmonics positive negative.svg

Dimensioni di questa anteprima PNG per questo file SVG: 265 × 251 pixel. Altre risoluzioni: 253 × 240 pixel | 507 × 480 pixel | 811 × 768 pixel | 1 081 × 1 024 pixel | 2 162 × 2 048 pixel.
File originale (file in formato SVG, dimensioni nominali 265 × 251 pixel, dimensione del file: 22 KB)
| Questo file e la sua pagina di descrizione (discussione · modifica) si trovano su Wikimedia Commons (?) |
Dettagli
| Descrizione |
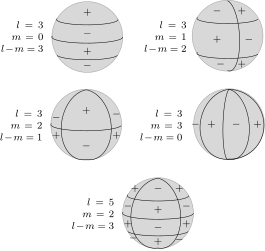
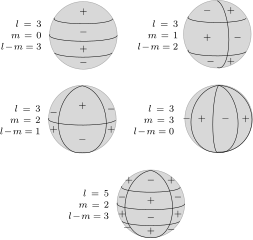
English: Representation of a spherical harmonic by discrepancy to a sphere. |
| Data | |
| Fonte | Opera propria |
| Autore | Krishnavedala |
W3C-validity not checked.
LaTeX source code
|
|---|
\documentclass[12pt,border=1pt,tikz,class=scrartcl]{standalone}
\usepackage[T1]{fontenc}
\usepackage[utf8]{inputenc}
\usepackage{lmodern}
\usepackage{mathtools}

\usepackage{tikz-3dplot}
\usetikzlibrary{arrows,shapes,calc,positioning,matrix,fit}

\begin{document}
\scriptsize
\tdplotsetmaincoords{100}{170}
\begin{tikzpicture}[very thick,auto,
	info box/.style={align=right, text width=4em}]
	\node at (0,0) (p1) {\begin{tikzpicture}
		\draw[tdplot_screen_coords, fill=white!70!gray] (0,0) circle (1);
		\tdplotsinandcos {\sintheta}{\costheta}{0}
		\tdplotdrawarc {(0,0,-\sintheta)} {\costheta} {0} {-190} {} {}
		\tdplotsinandcos {\sintheta}{\costheta}{-30}
		\tdplotdrawarc {(0,0,-\sintheta)} {\costheta} {0} {-190} {} {}
		\tdplotsinandcos {\sintheta}{\costheta}{30}
		\tdplotdrawarc {(0,0,-\sintheta)} {\costheta} {-20} {-180} {} {}
		\node at (0,.7) {$+$};		\node at (0,.1) {$-$};
		\node at (0,-.4) {$+$};	\node at (0,-.8) {$-$};
	\end{tikzpicture}
	};
	\node [left=-.3em of p1,info box] {$l=3$\\$m=0$\\$l-m=3$};
	\node at (4,0) (p2) {\begin{tikzpicture}
		\draw[tdplot_screen_coords, fill=white!70!gray] (0,0) circle (1);
		\tdplotsinandcos {\sintheta}{\costheta}{-30}
		\tdplotdrawarc {(0,0,-\sintheta)} {\costheta} {0} {-180} {} {}
		\tdplotsinandcos {\sintheta}{\costheta}{30}
		\tdplotdrawarc {(0,0,-\sintheta)} {\costheta} {0} {-180} {} {}
		\tdplotsetthetaplanecoords{60}\tdplotdrawarc [tdplot_rotated_coords] {(0,0,0)} {1} {-180} {0} {} {}
		\node at (.4,.7) {$+$};	\node at (-.3,.7) {$-$};
		\node at (.6,-.1) {$-$};	\node at (-.3,-.1) {$+$};
		\node at (.4,-.8) {$+$};	\node at (-.2,-.8) {$-$};
	\end{tikzpicture}
	};
	\node [left=-.3em of p2,info box] {$l=3$\\$m=1$\\$l-m=2$};
	\node at (0,-2.5) (p3) {\begin{tikzpicture}
		\draw[tdplot_screen_coords, fill=white!70!gray] (0,0) circle (1);
		\tdplotsinandcos {\sintheta}{\costheta}{0}
		\tdplotdrawarc {(0,0,-\sintheta)} {\costheta} {0} {-180} {} {}
		\tdplotsetthetaplanecoords{35}\tdplotdrawarc [tdplot_rotated_coords] {(0,0,0)} {1} {0} {-180} {} {}
		\tdplotsetthetaplanecoords{125}\tdplotdrawarc [tdplot_rotated_coords] {(0,0,0)} {1} {0} {-180} {} {}
		\node at (-.85,.2) {$-$};	\node at (0,.4) {$+$};		\node at (.85,.3) {$-$};
		\node at (-.85,-.3) {$+$};		\node at (0,-.6) {$-$};		\node at (.85,-.3) {$+$};
	\end{tikzpicture}
	};
	\node [left=-.3em of p3,info box] {$l=3$\\$m=2$\\$l-m=1$};
	\node at (4,-2.5) (p4) {\begin{tikzpicture}
		\draw[tdplot_screen_coords, fill=white!70!gray] (0,0) circle (1);
		\tdplotsetthetaplanecoords{0}\tdplotdrawarc [tdplot_rotated_coords] {(0,0,0)} {1} {0} {-180} {} {}
		\tdplotsetthetaplanecoords{45}\tdplotdrawarc [tdplot_rotated_coords] {(0,0,0)} {1} {0} {-180} {} {}
		\tdplotsetthetaplanecoords{90}\tdplotdrawarc [tdplot_rotated_coords] {(0,0,0)} {1} {0} {-180} {} {}
		\tdplotsetthetaplanecoords{135}\tdplotdrawarc [tdplot_rotated_coords] {(0,0,0)} {1} {0} {-180} {} {}
		\node at (-.95,0) {$-$};	\node at (-.5,0) {$+$};
		\node at (.2,0) {$-$};		\node at (.8,0) {$+$};
	\end{tikzpicture}
	};
	\node [left=-.3em of p4,info box] {$l=3$\\$m=3$\\$l-m=0$};
	\node at (2,-5) (p5) {\begin{tikzpicture}
		\draw[tdplot_screen_coords, fill=white!70!gray] (0,0) circle (1);
		\tdplotsinandcos {\sintheta}{\costheta}{0}
		\tdplotdrawarc {(0,0,-\sintheta)} {\costheta} {0} {-190} {} {}
		\tdplotsinandcos {\sintheta}{\costheta}{-30}
		\tdplotdrawarc {(0,0,-\sintheta)} {\costheta} {0} {-190} {} {}
		\tdplotsinandcos {\sintheta}{\costheta}{30}
		\tdplotdrawarc {(0,0,-\sintheta)} {\costheta} {-20} {-180} {} {}
		\tdplotsetthetaplanecoords{40}\tdplotdrawarc [tdplot_rotated_coords] {(0,0,0)} {1} {0} {-180} {} {}
		\tdplotsetthetaplanecoords{130}\tdplotdrawarc [tdplot_rotated_coords] {(0,0,0)} {1} {0} {-180} {} {}
		\node at (-.65,.7) {$+$};	\node at (0,.7) {$-$};	\node at (.6,.7) {$+$};
		\node at (-.85,.2) {$-$};	\node at (0,.1) {$+$};	\node at (.8,.2) {$-$};
		\node at (-.7,-.7) {$-$};	\node at (0,-.8) {$+$};	\node at (.6,-.75) {$-$};
		\node at (-.85,-.3) {$+$};	\node at (0,-.4) {$-$};	\node at (.8,-.3) {$+$};
	\end{tikzpicture}
	};
	\node [left=-.3em of p5,info box] {$l=5$\\$m=2$\\$l-m=3$};
\end{tikzpicture}
\end{document}
|
Licenza
Io, detentore del copyright su quest'opera, dichiaro di pubblicarla con la seguente licenza:
Questo file è disponibile in base alla licenza Creative Commons Attribuzione-Condividi allo stesso modo 4.0 Internazionale
- Tu sei libero:
- di condividere – di copiare, distribuire e trasmettere quest'opera
- di modificare – di adattare l'opera
- Alle seguenti condizioni:
- attribuzione – Devi fornire i crediti appropriati, un collegamento alla licenza e indicare se sono state apportate modifiche. Puoi farlo in qualsiasi modo ragionevole, ma non in alcun modo che suggerisca che il licenziante approvi te o il tuo uso.
- condividi allo stesso modo – Se remixi, trasformi o sviluppi il materiale, devi distribuire i tuoi contributi in base alla stessa licenza o compatibile all'originale.
Cronologia del file
Fare clic su un gruppo data/ora per vedere il file come si presentava nel momento indicato.
| Data/Ora | Miniatura | Dimensioni | Utente | Commento | |
|---|---|---|---|---|---|
| attuale | 01:43, 2 dic 2014 | | 265 × 251 (22 KB) | Krishnavedala | User created page with UploadWizard |
Pagine che usano questo file
La seguente pagina usa questo file:
Utilizzo globale del file
Anche i seguenti wiki usano questo file:
- Usato nelle seguenti pagine di de.wikipedia.org:
- Usato nelle seguenti pagine di en.wikipedia.org:
- Usato nelle seguenti pagine di pt.wikipedia.org:
- Usato nelle seguenti pagine di tr.wikipedia.org:
- Usato nelle seguenti pagine di vi.wikipedia.org:
- Usato nelle seguenti pagine di zh.wikipedia.org: