
Imaging spectroscopy is a method of collecting imagery that acquires many bands of data over a large visible-shortwave infrared (VSWIR) spectral range with finer spectral resolution than traditional multispectral imaging. The EMIT instrument collects observations at 60-meter spatial resolution with a spectral range of 381 to 2493 nanometers (nm) across 285 bands with a spectral resolution of ~7.5 nm. The data produced through this method displays unique spectral signatures that can be used to identify materials more accurately, including the ten minerals of interest for the EMIT mission.
Why are there no EMIT observations over my specific study site?
EMIT’s main mission was to target various arid dust source regions across the globe between 52° N and 52° S latitudes as shown on the target mask map below. As the mission has progressed, some observations have been acquired outside of the original target mask area. Check out the EMIT Open Data Portal to see current and forecast coverage.
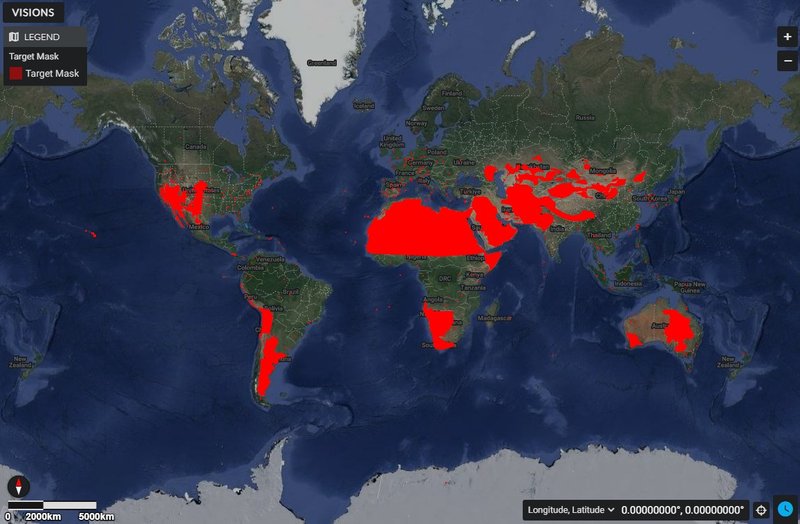
Target mask for EMIT mission. This map has areas of red indicating original target regions for EMIT mission.
Why are there gaps in the EMIT observation record?
The EMIT mission launched on July 14, 2022, and after the in-orbit checkout period was successfully completed, first light images were captured over Australia on July 27, 2022. Full science quality data collection began August 9, 2022. However, beginning on September 13, 2022, a power issue outside of EMIT caused a pause in operations. Due to this shut down, no data were acquired from that date through January 6, 2023. Once the power issue was resolved, data collection operations resumed.
How do I orthorectify EMIT data granules?
EMIT data products delivered as Network Common Data Format 4 (netCDF4) files are provided in a spatially raw, non-orthocorrected format. Each netCDF4 file holds a ___location group containing geometric lookup tables (GLT), which are orthorectified images that provide relative x and y reference locations from the raw scene to allow for projection of the data. Along with the GLT layers, the files also contain latitude, longitude, and elevation layers. The latitude and longitude coordinates are presented using the World Geodetic System (WGS84) ellipsoid.
To help users access and work with EMIT data, the LP DAAC provides a GitHub repository containing various guides, short how-tos, and tutorials in the form of Jupyter Notebooks. These EMIT resources include a tutorial on How to Orthorectify EMIT data.
How does the EMIT mission support Open Science?
To help facilitate Open Science, all EMIT data are available publicly at no cost. The EMIT science team has also made the science data system code used to generate the data products publicly available. The code repositories are available through the emit-sds GitHub page. The programming languages include Python along with C++, R, Julia, and a few others. The EMIT team and the LP DAAC have also hosted workshops to showcase EMIT data and provide information on how to work with various data products. The LP DAAC also provides a number of guides, tutorials, and how-tos through GitHub.
Other than mineral mapping, what applications does EMIT data have?
While the main mission for EMIT is to map the surface mineralogy of arid dust source regions, there are various active and potential applications for EMIT data. Active applications include mapping greenhouse gases such as methane and carbon dioxide, and determining snow properties and water resources. Some potential applications include natural hazard detection, monitoring of crop health and agricultural production, forest management and fire-related mapping, and many more. With its wide coverage of the visible to shortwave infrared spectrum, the data produced by EMIT already have many applications, and new applications for this data will undoubtedly continue to arise.
Why are there black rectangular segments that stretch across some scenes?
The EMIT instrument has conservative on-board cloud filtering, which omits those portions of an affected scene when it is downlinked from the International Space Station (ISS). Due to the omission of those regions in the downlinked data, no information is delivered and thus not available for analysis.
Why are there obstructions blocking some images?
Occasionally the ISS must adjust the position of its solar panel arrays, which may pass into the EMIT field of view.